.png)
5th Grade Climate Champions for Change
- Zoe Randall
- Jul 28, 2023
- 7 min read

“We didn’t know what we were getting into…” - Alaska “... and that’s awesome!” -Zoë
Written by: Alaska English and Zoë Randall
Alaska English is a Grade 4/5 combo teacher at Clay Elementary in Southeastern San Diego.
Zoë Randall is a STEAM Architect for San Diego Unified.
They are part of a larger collaborative team which includes the San Diego Science Project at UC San Diego, the SoCal Heat Hub at Scripps Institution of Oceanography, and the San Diego Unified School District STEAM Team.
After attending the Climate Champions Design Summit, our STEAM Design Team was inspired to create the first unit for the 5th grade STEAM curriculum at San Diego Unified. This partnership led to active science lesson design for fifth-grade students.

This blog shares an interview of Alaska reflecting on her experience this past Spring while collaborating on the 5th grade STEAM curriculum pre-pilot, “Cooler Communities.”
Project spark
Tell us about the unit that was developed…
“Cooler Communities” is a 5th grade unit inspired by the Climate Champions Design Summit.
In this project, students embarked on a journey of discovery, innovation, and action to understand global change in our communities.
They explored land surface temperatures and vegetation differences in San Diego County, using satellite data, scientific mapping, and their own on-campus temperature measurements. Throughout the project, students used experiences to build their knowledge that led to them modeling their understanding of global changes using the Understanding Global Change Framework developed by Dr. Jessica Bean at University of California, Berkeley.
As climate champions, students took on a design challenge to combat urban heat and designed a map sharing hopes for their future community. Using the map, students reflected on what changes would need to happen to make their future designs a reality.
How did you take an adult learning experience and make it accessible for 5th graders to understand and create models?
We drew inspiration from our own experiences as adult learners through participating in experiments and exploring mapping techniques during the Climate Design Summit. As a team, our goal was to create a project that would make learning about climate change relevant and meaningful for 5th grade students.
Using the Land Surface Air Temperature (LSAT) data sets and Normalized Difference Vegetation Index (NDVI) maps we received from the researchers at the SoCal Heat Hub at Scripps Institution of Oceanography allowed us to delve into how heat affects various aspects of Earth's systems. By comparing the data with satellite imagery from Google Earth and NDVI vegetation maps of San Diego County, we were able to formulate our own observations and questions. Then, we modeled our understanding using the Understanding Global Change (UGC) Framework from Dr. Jessica Bean’s research at University of California Berkeley.
During our analysis of the heat map data, we realized that 5th grade students could become experts in understanding their own community's climate. With this insight, we decided to focus our exploration of climate change starting from the school as a central hub of learning.
Project Design
How was each lesson designed?
Lesson 1 - How does temperature affect my daily life?
We started with temperature in our daily lives and having students think about temperature and how temperature affects them throughout the day and it was interesting to see how the kids went from surface level thinking from temperature is hot outside to going deeper to think about heating up bread to toast, or how the temperature affects what they wear and can do. They were put in expert groups and did a scaffolded exercise to showcase how temperature affects different parts of their day.
Lesson 2 - What patterns in land temperature do we notice in San Diego?
We kicked off the lesson by looking at how the land has changed over the years by comparing pictures past and present of Balboa Park and UCSD. Students noticed there were generally less buildings and roads and more vegetation in the past than today.
We let students explore Google maps with a focus on different regions of San Diego County (the Anza Borrego desert, Camp Pendleton’s undeveloped coast, San Diego Bay and surrounding developed coastal region, and the mountains of Julian). They documented the land features and human impact on those places.
We realized the importance of productive play and exploration with Google Earth prior to presenting them with the LSAT data. Students really enjoyed seeing the differences between the regions of San Diego County, such as noticing the urbanization of the San Diego Bay.

Then, we shared the LSAT data maps of San Diego County as the anchor phenomenon for students to base their inquiry on throughout the unit. Students really enjoyed the activity and it helped solidify their understanding of the LSAT data. Students developed observations and wonderings based on their exploration of the LSAT data as they moved into noticing how some areas of San Diego are warmer than others.
Students noticed various aspects of the data such as the key on the side to think about how hot different temperatures were and what that meant in relation to the map. They noticed the roads were darker and hotter, and the areas of vegetation were cooler. More urban areas were hotter than less urbanized areas. Students built more experience with modeling using arrows and labels on Google slides to help them explain their observations and wonderings.
Lesson 3 - What materials heat up the most versus the least?
Students began this lesson by freely exploring the new tool of an IR thermometer as they played with the temperatures of the items around them in the classroom and themselves.
Then they conducted a lab investigation on how different materials heat up when exposed to light outdoors, a heat lamp and a control (indoor classroom environment) using IR thermometers. They tested grass, artificial turf, black concrete, white concrete, black asphalt, wood, and dead leaves under these different heat sources.
Students noticed that some materials heat up much faster and hotter than others.

Lesson 4 - What patterns in land temperature do we notice at our school?

Students were excited about the data they were gathering, so we gave them the LSAT data for their own community. They compared this data side by side with Google Earth to see which areas to label as hot areas and cool areas of their community.
Then they zoomed on a particularly cool area of Clay and students responded with excited wonder! They predicted the reason the part was lighter was because of the field and their prior knowledge heating up less and the darker areas were the buildings and playground.
Then we introduced the UGC model for them to map their understanding of how environmental and how different environmental impacts are connected/affected by each other.

Students related Earth systems, a 5th grade Next Generation Science Standards (NGSS) Performance Expectation, to their community data using the maps from scientific researchers and their own local temperature data highlighting the connection between research, teachers and students.
Lesson 5 - What do you predict will be the land temperatures around our school?
Students watched a video to learn more about how LSAT data is collected and engaged with the Show your Stripes data to see changes in temperature over time around the world.
Students took their predictions and conducted a temperature scavenger hunt around their school to get the temperature data themselves.
They measured temperatures of certain materials in the morning and again in the afternoon around school.
Students noticed that the biggest difference was that dirt heated up the most.
Final Lesson - How can we make our community cooler?
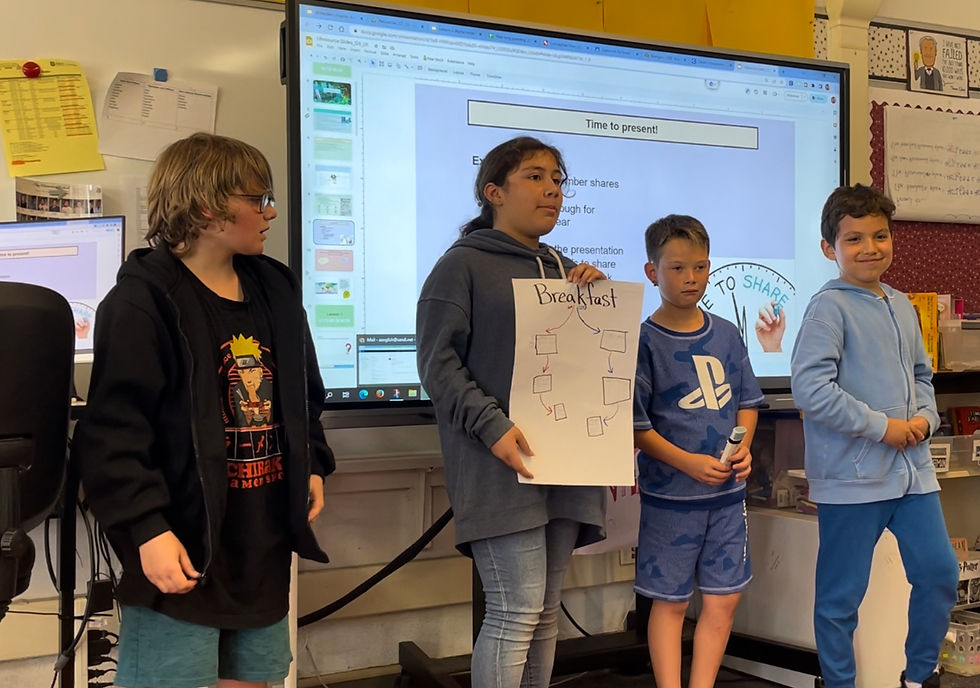
This experience laid the foundation for the future of this curriculum. Students started to think about the future community they would like to see that would be cooler literally and figuratively. Through a rapid prototype of the design process, students created maps of their future communities that shared their hopes and ideas for how to cool their communities down. All of their designs included vegetation which hopefully inspires action towards making that future a reality.

Our Curriculum Development Process
Can you tell us about the process of developing this unit?
This project was a pre-pilot for the development of the 5th grade STEAM curriculum for the San Diego Unified School District.
STEAM is a hands-on, inquiry based approach to learning science. Through their learning, students become curious about their world, create solutions to problems and become changemakers who can see the impact of their own actions on their world.
Our STEAM Design Team worked together to create the conceptual flow of the unit. They used the anchoring phenomenon of LSAT data from the Climate Champions Design Summit. Then, we created an essential question, investigation questions that were NGSS standards aligned, and a final product for student inquiry.
Alaska took those initial ideas and wrote the curriculum and piloted it in her classroom at Clay Elementary with her 4th and 5th grade students. She used a process of reflection to inform her next steps based on what happened with students the previous day.
Promoting curiosity and students as changemakers
Our focus for 5th grade curriculum development was designing with the community. This experience has shown the importance of being able to test and prototype ideas with students and be able to make changes to the curriculum as you see it in practice. Learning directly from students helped shape the curriculum and make it better, more engaging and relevant to students.
Hopes for the Future
What do you hope teachers will learn and apply within their own classroom?
We hope to create a relevant and useful STEAM unit for 5th grade teachers to apply and bring to their students with the idea that students can make positive changes in their community through learning about climate change and impacts.
What do you hope you will learn from your students?

We learned so much about how 5th grade students can make meaning of real world scientific data and apply it to making sense of their lives and the world around them. We see students as being changemakers who can do something now with their learning.
Students had a high level of engagement throughout the unit as they experienced different data and tools for learning about climate change. This unit felt relevant to students because of the local and global connections they saw through the data and were empowered to use the data to inform their future decisions.
We hope students learn that the things they can do can have a positive impact on their community and the world.
What’s next?
We look forward to further development of the curriculum with the San Diego Science Project and the researchers at Scripps Institution of Oceanography to introduce weather labs and micro bits into the curriculum.
Resources
Link to Video: https://youtu.be/cIYE157nTDQ
Gratitude to our Collaborators
Alaska’s students; Grades 4/5 Class of 2023
STEAM 5th Grade Design Team, San Diego Unified - Cady Staff Hwang, Lacy Szuwalski, and Thomas Courtney
UC San Diego San Diego Science Project - Alec Barron
SoCal Heat Hub, Scripps Institution of Oceanography - Nan Renner, Maren Hale
UC Berkeley, Understanding Global Change - Jessica Bean


